Blog articles

Journal Club: Validation of LSV and RP-HPLC to determine content and purity

Written by Anindya Ghosh Roy Posted in Method validation

Introduction and background

Fulvestrant or Faslodex is a drug used to cure hormone receptor-positive (HR+) metastatic breast cancer in postmenopausal women with disease progression. It belongs to the group of Selective Estrogen Receptor Downregulators (SERD) and is often considered a suitable replacement for Tamoxifen. It functions by binding to the estrogen receptor and destabilizing it, promoting degradation by the cell's normal protein degradation mechanism. For Fulvestrant’s content determination in pure and pharmaceutical dosage form or its purity, there has been no HPLC (High Performance Liquid Chromatography) or LSV (Linear Sweep Voltammetry) methods reported thus far. In this post, we would like to highlight such methods, developed by Atila et al., with focus on their advantages and compliance to method validation.

Journal Club: Validation of a photometric method for content determination

Written by Dr. Janet Thode Posted in Method validation

Introduction and background

Every drug development process starts with the identification of a drug molecule that has the potential to battle, control, prevent or cure diseases. Within the process of identification of such compounds several analytical procedures are involved. It is mandatory to have the molecule free from unwanted impurities, to show that the molecule possess the right concentration within the formulated drug, to verify its identity and potency. Hence a variety of analytical methods is employed.

About small values with huge influence - Sum Of Squares - part 2

Written by Gastautor Posted in Method validation

In the first part of this blog article we became familiar with the RSS and started to get an insight about the influence of the individual data values. This is followed by this part.


Hat Values and Cook’s Distance – what is really influencing the regression line?

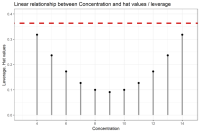
So far, we were thinking about the influence of data points, but have actually not clarified what influence actually means. One intuitive way to think about that is to consider what would happen to the regression line if a single data point would be removed from the data set. If one data point has a big influence on the regression line, then, removing that data point should change the regression line a lot, which can be measured by a difference in the slope and/or y-intercept. This can be done and is shown in the following Figure 1: