The confidence interval in method validation
In today's blog article we’d like to deal with the role and application of confidence intervals during method validations.
What do we know
In a previous blog article, we provided a general overview about confidence intervals. We know so far that a confidence interval covers an area in which, with a certain probability (confidence level) and repeated measurements, the true location of a parameter (e.g. the mean), thus the “true value µ”, lies. Thus, it targets the precision of the measurement. The confidence level can be selected as 90, 95 or 99%, for example.
In our example of the API content of tablets, we have calculated that the true mean is between the lower (396.4 mg) and upper limit (401.2 mg) applying a confidence level of 95%. This was based on normal distribution and a randomly drawn and sufficiently large sample. In addition, we've learned that the higher we raise the confidence level (for example, from 90% to 95%), the wider the confidence interval, and the more the precision drops. What we didn’t tell yet is that precision is a measure of the standard error of the mean (SEM) of an estimate. SEM considers the sample size n and the scatter, i.e. standard deviation σ, within the population (and thus also the sample). This makes it easy to understand the formula for the calculation of the confidence interval [Note: z is not the α error, but the corresponding z-value]:
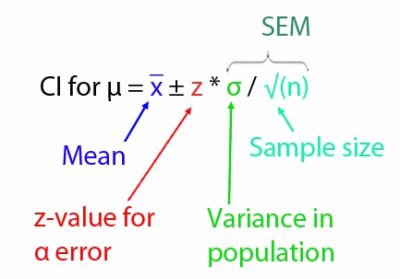
Another short note on the wording: the α error is also called probability of error or significance level. It is calculated as 1- confidence level (e.g. 1 - 0.95 = 0.05 = 5%) and gives us information about the residual risk of being wrong with our assessment, i.e. that our confidence interval doesn’t contain the true value, although we assume it "false positively"...
What is required
According to the current ICH Q2(R1) guideline of 1996 respectively 2005 for the validation of analytical methods of drug substances and drug products, it is required to provide confidence intervals for both trueness and all types of precision.
Regarding the validation of bioanalytical methods, confidence intervals are not required by the current documents of the EMA, the FDA, the Japanese or Brazilian Health Authority, although in bioanalytical methods, trueness and precision are also validation parameters to be examined. However, the corresponding guidelines are more recent…
As part of a large number of method validations with different clients, I only encountered the explicit declaration of confidence intervals with one client because his client requested it. Depending on the method to be validated and the year, there was everything available for the parameter precision: declarations of confidence intervals for really every kind of precision such as repeatability, intermediate precision and also reproducibility (since 2 QC sites were involved), but also a single indication of one confidence interval for an overall precision, all completely independent of sample size. Which brings us to the subject. For me, from a statistical point of view, it doesn’t really make sense to calculate a confidence interval for a sample with n = 6 (which usually is the case for repeatability). How reasonable it is for n = 9 (for trueness with 3 replicates at 3 concentrations) or n = 12 (for intermediate precision with 2 analysts and 6 replicates on two days), everyone may decide for himself. However, for samples with n ≥ 15, the width of their confidence interval doesn’t change much [1]. For this reason, providing a confidence interval for an overall precision, which summarizes the results of all individual precision experiments, could be a good idea at least from a statistical point of view. An indication of a confidence interval for the trueness I met only once and for each concentration individually, thus each time for n = 3...
Regardless of my personal experience, at least the Malaysian health authority seems to (or did) emphasize the declaration of confidence intervals for trueness and precision in analytical method validations...
It is useful, when…
Let's start with an example of an HPLC method. With constructed data for precision and trueness, it could look like this:
| Precision | Trueness | |||||||
|
Overall precision |
Relative peak area [Area%] | Level [%] |
Absolute peak areas [µAU*s] | Recovery [%] | ||||
| Measured data | Calculated data | |||||||
| Repea-tability | 1 | Day 1: operator 1 | 93.53 | 120 | 37106293 | 36727113 | 101 | |
| 2 | 93.68 | 37077541 | 101 | |||||
| 3 | 93.54 | 37330854 | 102 | |||||
| 4 | 93.55 | 110 | 34181732 | 33711289 | 101 | |||
| 5 | 93.58 | 33749143 | 100 | |||||
| 6 | 93.63 | 33893159 | 101 | |||||
| Inter-mediate precision | 1 | Day 1: operator 2 | 93.46 | 100 | 30047214 | 30695466 | 98 | |
| 2 | 93.22 | 30285204 | 99 | |||||
| 3 | 93.44 | 30030762 | 98 | |||||
| 1 | Day 2: operator 1 | 93.55 | 90 | 27863052 | 27679643 | 101 | ||
| 2 | 93.50 | 27549713 | 100 | |||||
| 3 | 93.54 | 27499621 | 99 | |||||
| 1 | Operator 1: equipment 2 | 93.42 | 80 | 23724539 | 24663819 | 96 | ||
| 2 | 93.48 | 23633961 | 96 | |||||
| 3 | 92.95 | 23871057 | 97 | |||||
| Mean [Area%] | 93.54 | Mean [%] | 99.23 | |||||
| SD [Area%] | 0.25 | SD [%] | 1.93 | |||||
| RSD [%] | 0.27 | RSD [%] | 1.92 | |||||
| 95% CI [Area%] | 93.41 to 93.66 | 95% CI [%] * | 98.25 to 100.20 | |||||
* see update at the end of this text
Although all data including confidence intervals are given in this example, the question arises what’s the benefit. A confidence interval originated from overall precision data could be used to refine the range, which is derived from linearity while considering trueness and precision, by paying special attention to the lowest and highest value. In addition, a determination of confidence intervals based on precision data of e.g. various intermediates of a manufacturing process might help checking the appropriateness of that method for the analysis of all of these intermediates.
This seems plausible, but the meaning and usefulness of a confidence interval for recovery, that is, trueness, is still not clear to me... Somewhere during research for this article, I read two interesting things:
- “Confidence interval: The precision of findings”
- “Confidence intervals are focused on precision of estimates — confidently use them for that purpose!”
This suggests that confidence intervals do not necessarily should be applied to trueness...
Otherwise, specifying or examining data using confidence intervals might make sense for linearity in some cases, e.g. if it’s desired or known that the y-axis intersection encompasses the origin it can be checked by means of a confidence interval. Or, for the statistics-enthusiastic analyst, a residual analysis can be used to examine if the residuals are normally distributed within the 95% Lilliefors confidence interval in a normal quantile plot.
Also, as an acceptance criterion, a confidence interval may be useful, e.g. for robustness examination of an HPLC method with known position of the mean and the corresponding confidence interval to comply with. In that case, we can easily check whether the mean values obtained under modified conditions (e.g. different pH of the mobile phase) are within the known confidence interval or not. The same is true when assessing the robustness of a TOC determination to check whether a long sample storage period is influencing the results. Therefore, the results of the stored samples are compared with the confidence interval of a previously analyzed fresh sample. Similar in SDS-PAGE, when a new reference standard should be introduced. Regarding specificity, it could be defined as acceptance criterion that the mean value of the main band of the new standard should be within the confidence interval of the old known standard. For validations of bioanalytical methods, the use of confidence intervals, for example for stability studies, is described [2].
Another application of confidence intervals may be the examination for compliance with the specification limits during method capability, unless the usual 6-fold standard deviation isn’t used. But diving deeper into this topic would go beyond the scope of this article ;-)
Conclusion
Despite the requirement to provide confidence intervals for precision and trueness of the ICH Q2(R1) guideline, the implementation of these requirements during method validation doesn’t seem to be expected by every authority, which is absolutely justified from a statistical point of view. Nevertheless, there are also possibilities to use confidence intervals meaningfully during method validations, e.g. in robustness evaluations.
Update 04.09.2019
Due to helpful comments while discussing this article at Linkedin, the formula should be corrected / precised: for small sample sizes, as it is the case in method validation, t-student statistics is recommended for use instead of z-statistics for the calculation of the CI. Z-statistics is used for large sample sizes (n > 30) and is a special case of the t-distribution at infinite degrees of freedom.
In addition, it should be noted if a CI is requested, the confidence level as well as the sample size should be provided.
For trueness, I’ve been told, that CIs are calculated for each level separately. Although this means that for each CI the n is just 3, which doesn’t make much sense from my point of view…
References
[1] Ellison S.L.R., Barwick V.J., Duguid Farrant T.J. (2009). Practical Statistics for the Analytical Scientist: A Bench Guide, 2nd edition, RSC Publishing, ISBN: 978-0-85404-131-2, chapter 9.2.2.1
[2] Rudzki P.J., Leś A. (2008). Application of confidence intervals to bioanalytical method validation – drug stability in biological matrix testing, Acta Pol Pharm., Vol. 65 (6): 743-747