What is meant by the limit of detection and quantification (LOD / LOQ)?

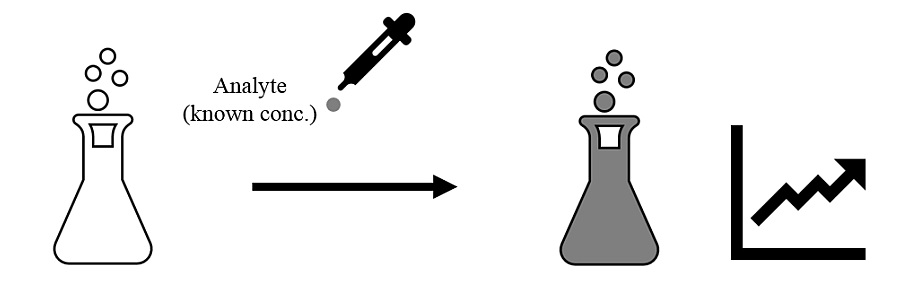
In our blog today, we would like to discriminate between the limit of detection (LOD) and the limit of quantification (LOQ). Both are terms relevant for analytical method validation.
Limit of Detection (LOD)
The limit of detection LOD (or detection limit, DL) is the lowest possible concentration at which the method can detect (but not quantify!) the analyte within the matrix with certain degree of confidence. It is also defined as the lowest concentration that can be separated from a background noise with some reliability. Usually, the limit of detection is determined only for qualitative determinations of impurities / limit tests but may sometimes also be required for quantitative determinations. Depending on whether the method is instrumental or non-instrumental, different recommendations are made by the ICH Q2(R1) method validation guideline. LOD can be evaluated in 3 different ways:
1. Visual examination:
This way of detection is mostly common for methods that do not use any instruments. One example could be the detection of the minimum concentration of an antibiotic required to inhibit the bacterial growth. The detection is checked using antibiotic discs and then by calculating the zone of inhibition.
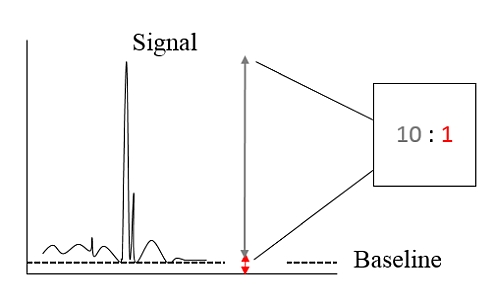
2. Determination of the Signal to Noise Ratio (S/N):
This detection method can only be applied for methods that show a baseline noise, e.g. HPLC methods. It is a measure by comparing signals of samples containing a low concentration of analyte against the signal of the blank and determine the minimum concentration at which the analyte signal could be reliably detected. A generally acceptable signal to noise ratio for the estimation of the detection limit is 3:1 (or previously used 2:1).
3. Standard deviation (SD) and slope:
This evaluation method is also for analytical tests using instruments. For the detection using SD and slope, two possibilities arise:
a. Detection based on the SD of the blank: This involves measuring a required number of blank samples and calculating the SD from the obtained values.
b. Detection based on the calibration curve: (A) calibration curve(s) must be obtained using samples containing an analyte in the range of the LOD. The ICH Q2(R1) guideline recommends to use the standard deviation of y-intercepts of regression lines as the standard deviation to be inserted in the formula below (this implicates that not only one but several calibration curves have previously been generated) or the residual standard deviation of the regression line. As we didn’t have the chance yet to follow this approach in any of our client’s projects, we had a short internal discussion about what could be meant by this. We can imagine calculating the SD within one regression line if normalizing all values e.g. to 100%, but we are not quite sure if this is what the ICH wants. We followed this question and reported in a new blog article.
Irrespective of the evaluation technique, the LOD is calculated in the following way:
LOD = 3.3 * σ / S
Where,
σ = SD of the obtained results
S = Slope of the calibration curve.
And what’s statistically behind the factor of "3.3", you’ll learn in this article.
Limit of Quantification (LOQ)
The limit of quantitation LOQ (or sometimes also referred as quantification limit, QL) is the lowest possible concentration of the analyte that can be quantified by the method in a reliable way. Reliable means, that a suitable precision and trueness must exist and be demonstrated. The determination of the limit of quantification is required for quantitative determinations of impurities and degradation products, respectively. Like LOD, LOQ can also be determined in various ways depending on whether the method uses an instrument.
1. Visual examination:
Detection by analysis of samples with known concentrations of the analyte and estimating a minimum level at which the concentration can be quantified. A good example for a visual examination of the LOQ is the titration of two chemical substances. A known concentration of the analyte is added until the colour of the mixture changes.
2. Determination of the Signal to Noise Ratio (S/N):
As explained for LOD, LOQ also can be determined using signal to noise approach where the signals of the known concentration of the analyte is compared to that of the blank and establishing the concentration at which it could be quantified with some confidence. A S/N ratio of 10:1 is generally accepted. Examples are chromatographic methods.
3. Standard deviation (SD) and slope:
Like as for the LOD, there are two possibilities to determine the SD and slope for the calculation of LOQ:
a. Based on the SD of the blank: Same as in LOD. Measure several blank samples and calculate the SD from the obtained responses.
b. Based on the calibration curve: Using samples containing an analyte in the range of the LOQ you must obtain and study (a) calibration curve(s). The possibilities to evaluate are the same as for LOD with the same - currently resolved - question.
LOQ is calculated as follows:
LOQ = 10 * σ / S
Where,
σ = SD of the obtained results
S = Slope of the calibration curve.
Examples, where this evaluation approach is used, are photometric content determinations of impurities or ELISAs.
In conclusion, the determination of the limit of detection LOD as well as of the limit of quantification LOQ is important as they both provide information on the ability of the method to determine very low concentrations of the analyte (still to be determined specifically = LOQ or merely to be able to detect = LOD). Especially in case of methods for the detection of very small amounts of impurities these two values are very useful. For potency or content determinations (assays) they are not required by the ICH Q2(R1) guideline, which absolutely makes senses, since for these determinations usually a 100% test concentration is used. The evaluation techniques for LOD and LOQ are very similar except for the acceptable values for the S/N approaches and the constant values used for the determination using SD and slope (3.3 for LOD and 10 for LOQ). The reason behind is logical: the certainty to trust the results must be higher when you still want to quantify (LOQ) instead of only detecting (LOD). The outdated terms of analytical and functional sensitivity, originating from the clinical area, should be abandoned.