Using the relative response for method validations and routine measurements
A wide variety of analysis methods are used in the pharmaceutical quality control laboratory. In addition to methods to proof the identity of the active pharmaceutical ingredient and qualitative tests, quantitative determinations are also included. A (calibration) standard of different concentrations is run in parallel within each analysis and the intensity of the measurement signal (detector response) is then plotted against the concentration.
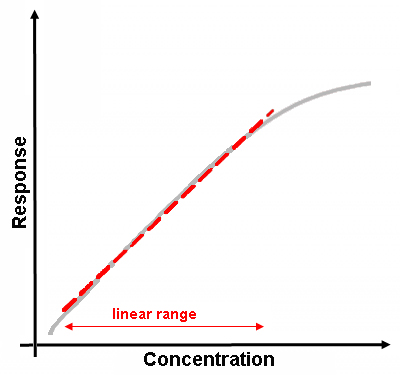
Afterwards, the linear range of such a standard curve is used to determine the unknown concentration of a sample based on its measurement signal using linear regression.
And what is the “relative response”?
We know that a linear relationship can be characterized using the correlation coefficient R or the coefficient of determination R2, whereby a value of > 0.99 actually points out to a very, very good linear relationship between measurement signal and concentration... Actually... This only shows that the regression line can be mapped very well by the measured values, but it doesn’t tell us anything about how far individual measurement signals deviate from the ideal line.
Let's have a look using a practical example. We’ve got a photometric method for content determination, in which 4 concentrations of the standard and the blank value were measured in triplicates:
| Conc. [µg/mL] |
Absorbance [-] | |||
| Replicate 1 | Replicate 2 | Replicate 3 | Mean | |
| Blank (0) | 0.020 | 0.020 | 0.018 | 0.019 |
| 2 | 0.073 | 0.073 | 0.102 | 0.083 |
| 4 | 0.129 | 0.130 | 0.130 | 0.130 |
| 6 | 0.165 | 0.169 | 0.171 | 0.168 |
| 8 | 0.256 | 0.258 | 0.258 | 0.257 |
The mean values minus blank are plotted against the concentrations and we’ll receive the following standard curve:
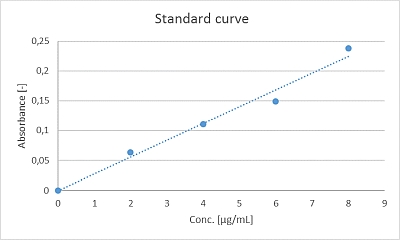
At first glance, it doesn't look so bad, and the calculated correlation coefficient is damn good having a value of 0.9904. So, everything's alright? Maybe not everything… Not all of the measured values are located exactly on the straight line, but rather deviate a little upwards or downwards. In order to be able to assess this in more detail, we now determine the "relative response". This is nothing else than dividing the measurement signal (= response) by the concentration (please don't confuse with the slope of the calibration curve / “calibration sensitivity”, as slope = Δy/Δx). We perform this for each of the 4 concentrations and then also calculate the mean as well as corresponding limit values (here: ± 10% of the mean, these limit values can be based, e.g., on the measurement uncertainty of the devices used or internal accuracy requirements):
| Conc. [µg/mL] | Response (blanked) [-] | Relative response [-] | Mean relative response [-] | Relative response range (Mean ± 10%) |
Individual relative response included in the range? |
| 2 | 0.063 | 0.032 | 0.028 | 0.026 - 0.031 | no |
| 4 | 0.110 | 0.028 | yes | ||
| 6 | 0.149 | 0.025 | no | ||
| 8 | 0.238 | 0.030 | yes |
We expect the determined individual relative response values to fluctuate around a horizontal mean line; ideally, they should all be located exactly on this line or at least do not deviate too much. To get a better idea of this, we now plot the determined individual relative response values against the concentration analogous to a quality control chart, add the mean as green line and the ± 10% of the mean limit values as red border lines. Taking a look, we unfortunately realize that the relative responses of the concentrations 2 and 6 µg/mL are skimpy outside the limits we’ve chosen. This means that, despite a correlation coefficient of >0.99, there is no linearity.
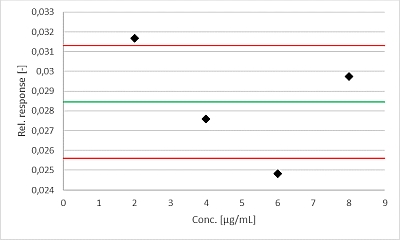
The picture is somewhat reminiscent of a residual plot, which basically doesn’t want to tell us anything else. Personally, however, the calculation of the relative response seems to be a bit easier than that of the residuals, but that might be a matter of taste...
(We can also see in our example that the 3rd replicate of the 2 µg/mL concentration doesn’t fit at all, but that's another story...)
And what’s it good for - when can it be used?
The question is justified. Two options spontaneously are coming to mind.
First, it can be used in the context of method validation in investigations of linearity, because the guideline for method validation, the ICH Q2(R1), requires the following:
"[...] In addition, an analysis of the deviation of the actual data points from the regression line may also be helpful for evaluating linearity.".
Calculating the relative response in combination with a corresponding acceptance criterion (e.g. that the individual values are not allowed to deviate by more than ± 10% from the mean relative response, as in our example), is one possibility to fulfill this requirement. Other statistical options for examining the individual values would be Hat Values and Cook’s Distance...
And secondly, the calculation of the relative response of the standard using appropriate limit values can also be used as system suitability test (SST) criterion for methods that are not quite as robust and that tend to show outliers during routine measurements as part of release and stability analysis.