Trueness, accuracy and precision
Why does it make sense to determine "accuracy" and "precision" during method validations? What’s behind? And how are the terms "trueness", "accuracy" and "precision" related to each other?
According to the method validation guideline ICH Q2(R1), only “accuracy” and precision must be determined during method validations. They are defined in ICH Q2(R1) as follows [1]:
“The precision of an analytical procedure expresses the closeness of agreement (degree of scatter) between a series of measurements obtained from multiple sampling of the same homogeneous sample under the prescribed conditions. Precision may be considered at three levels: repeatability, intermediate precision and reproducibility.”
“The accuracy of an analytical procedure expresses the closeness of agreement between the value which is accepted either as a conventional true value or an accepted reference value and the value found. This is sometimes termed trueness.”
And this is exactly where there is a weakness: Accuracy and trueness are not the same according to ISO 5725-1 [2], but are pretty easily mixed up or lumped together. Before getting to the bottom of this, however, the question of the sense of such determinations is easier to answer. All measurements that are carried out are accompanied by measurement errors, which can be classified into random and systematic errors (see also our corresponding blog article). And the evaluations of accuracy or let’s better say trueness and precision reveal exactly such errors, as we will see below.
Trueness
Trueness actually expresses what the ICH Q2(R1) says for accuracy, namely the degree of agreement between the mean of a data set and the "true value" (target-performance comparison). However, since the true value is only of theoretical nature and you can never determine it exactly, a reference value that is regarded as correct is used instead (which of course also has a certain degree of uncertainty). Correspondingly, the definition of trueness according to ISO 5725-1 is as follows:
“The closeness of agreement between the average value obtained from a large series of test results and an accepted reference value.”
Mathematically expressed, we can also say that trueness represents the difference between the mean x and the reference value xRef: trueness = |x − xRef|
Thus we can deduce that trueness tells us something about the position of the mean, therefore it is also called “accuracy of the mean”, what I personally really like, but, what is discouraged by the ISO 5725-1.
In order to express the distance between the mean and the reference value, the percentage error (%error) or the recovery rate is used to indicate trueness, since it relates the two variables (mean and reference value) to one another.
Trueness is influenced by systematic errors (bias). A "true" result, i.e. a high degree of trueness, is obtained if the mean of the measurements agrees well with the expected reference value. This means that there are no or only small systematic errors. However, it doesn’t tell anything about the distribution of the individual measurement values, i.e. their scatter. This is expressed by precision, but more on that later.
Metaphorically speaking, there is a high degree of trueness if a soccer player generally hits the goal regardless of whether it is in the upper left or the lower right corner. Accordingly, there is little trueness if most shots are wrong. It gets interesting when, for example, our player shoots every single shot past the right side of the goal... We speak with him and realize that he unfortunately has a slight curvature in one leg. This is a good example of a systematic error: the distorted leg (analogous to a poorly calibrated measurement device) causes all shots (results) to be shifted in the same direction. This also shows that trueness cannot be improved with additional measurements (as the underlying systematic error would also shift the additional measurements in the same way).
Precision
As we already have indicated above, the precision is a scattering measure and provides information about the degree of agreement of individual, independent measurement values of a data set. It is a characteristic of a data set and characterizes the spread of the measurement values around the mean. [Note from the Editor: Logically, this means that a single measurement cannot be "precise" - if you want to do word quibbling...] Accordingly, it can be expressed by the (relative) standard deviation. But also a small range of values, a narrow confidence interval or a small distance between quartiles in a box plot illustrates high precision.
And what causes the scatter of the measurement values? Random errors!
In contrast to trueness, only the data set itself is considered for precision, regardless of an “external” reference value. No statement is made as to how far the measured values are from the true value. Therefore, a data set can have a high degree of precision (all values are close to each other, i.e. only have a very small spread), but it can be completely wrong. This is the case when our football player with the distorted leg only marginally misses the goal in every shot. This makes him very precise because the ball always ends at almost the same place, but unfortunately is wrong because the goal is not hit... The underlying random errors then influence the exact position of the ball next to the goal. This can one-time be a very slightly raised toe or another time be a gust of wind…
If we now ignore the leg curvature (= bias) and think of a healthy player, it is understandable that the precision can be improved with additional measurements and the measurement uncertainty can be reduced accordingly. More shots increase the likelihood of generally hitting the goal ;-)
Again, the background of the explanations above is the definition in ISO 5725-1 and the associated notes: „The closeness of agreement between independent test results obtained under stipulated conditions.
Note 1 to entry: Precision depends only on the distribution of random errors and does not relate to the true value or the specified value.
Note 2 to entry: The measure of precision is usually expressed in terms of imprecision and computed as a standard deviation of the test results. Less precision is reflected by a larger standard deviation.
Note 3 to entry: "Independent test results" means results obtained in a manner not influenced by any previous result on the same or similar test object. Quantitative measures of precision depend critically on the stipulated conditions. Repeatability and reproducibility conditions are particular sets of extreme conditions.”
Although expressed differently, the meaning of precision doesn’t differ between the ICH Q2(R1) and ISO 5725-1.
Accuracy
In contrast to precision, reference to the true value plays a role in accuracy, since accuracy is defined as the measure of the correspondence between an individual measurement value and the true (or reference) value. It is again a target-performance comparison. Hm, that somehow seems familiar... Trueness seemed to be similar, wasn't it? The difference to trueness lies in the fact that for trueness the mean of the data set and here only a single value is set in relation to the reference value. The calculation also differs because, mathematically speaking, accuracy is defined as the ratio of the difference between the measurement value xi and reference value xRef to the measurement value:
Accuracy = |xi − xRef| / xi
Accuracy is influenced by both types of errors (random and systematic errors). Accordingly, we can also say that it expresses how well trueness and precision are in harmony and therefore should be regarded as a generic term. A high degree of accuracy can only be achieved if both, trueness and precision, are good.
ISO 5725-1 defines accuracy as follows: “The closeness of agreement between a test result and the accepted reference value.” and adds the following annotation: “Note 1 to entry: The term accuracy, when applied to a set of test results, involves a combination of random components and a common systematic error or bias component.”
Differentiation, connection, and underlying error types
To sum up, we can state that the three terms trueness, precision and accuracy are to be differentiated on the one hand from one another by their definitions, but on the other hand they also have similarities and are related to each other, which is illustrated in the following table and figure:
| Trueness, accuracy of the mean | Precision | Accuracy | |
| Information | Distance of the mean from the reference value | Spread of individual values around the mean | Distance of a single measurement value from the reference value |
| - | Position parameter | Scattering parameter | Both |
| - | Data set | Data set | Single value |
| Error type | Systematic error | Random error | Both |
| Statistic | Mean | Standard deviation | - |
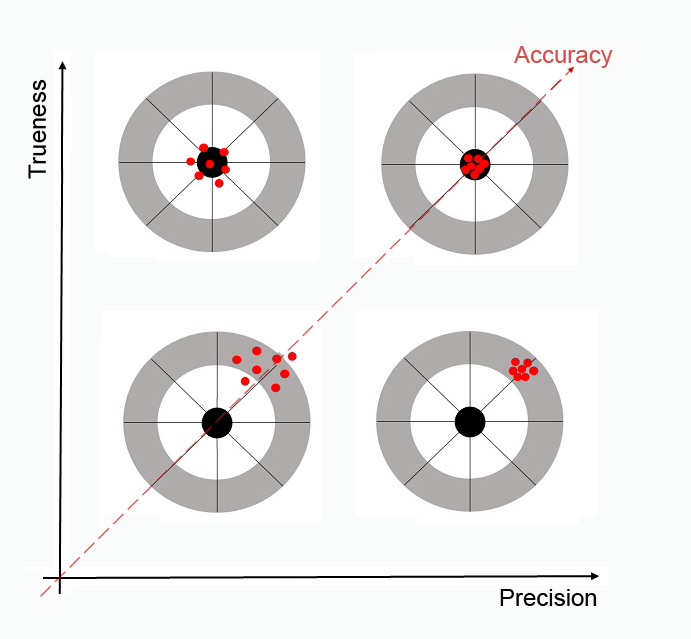
The relationships between these three terms and the underlying types of errors can be illustrated with the help of a beautiful picture (based on [3]).
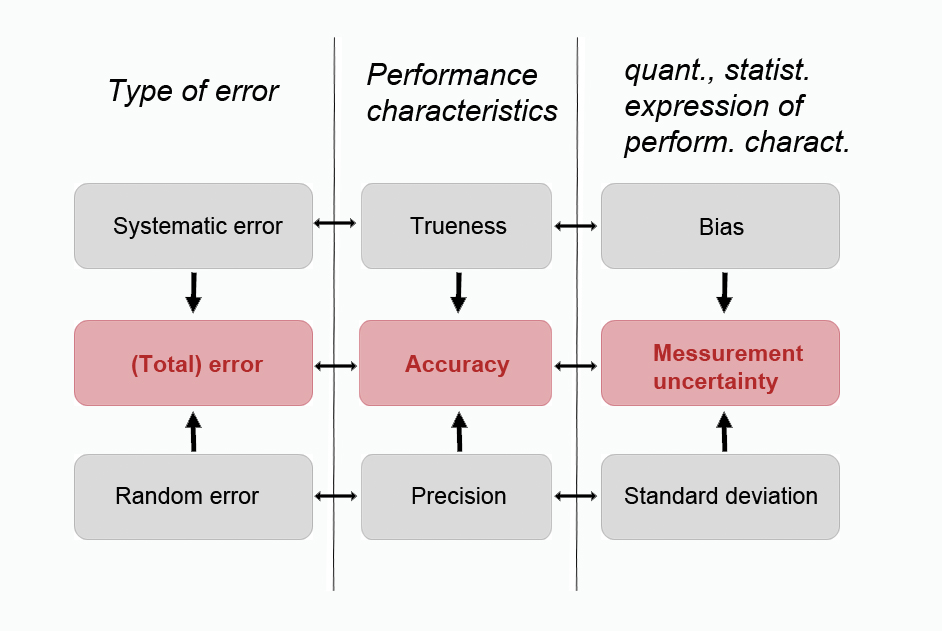
The figure illustrates the relationship between the terminology of the method’s performance characteristics (trueness, accuracy, precision) underlying error types (random, systematic, or total error) and their quantitative statistical parameters (bias, measurement uncertainty, standard deviation) used for expression. Each measurement possesses a total error, which is made up of random and systematic errors. Since these errors can never be completely determined, we must work with estimates of these errors, which are evaluated by the performance characteristics of the method. The evaluation of trueness targets systematic errors and the evaluation of precision addresses random errors, while accuracy includes both. The performance characteristics are expressed quantitatively by the statistical parameters' bias, standard deviation and measurement uncertainty.
Final Remark
In this blog article we deliberately did not go into the definitions of trueness, precision, and accuracy according to the JCGM [4]. However, in short, I’d like to point out that the definitions of precision and accuracy correspond roughly to those presented here, but that the one for trueness is slightly different.
References
[1] ICH Q2(R1) (2005). Validation of Analytical Procedures: Text and Methodology
[2] ISO 5725-1 (1994). Accuracy (trueness and precision) of measurement methods and results – Part 1: General principles and definitions
[3] Menditto A., Patriarca M., Magnusson, B. (2006). Understanding the meaning of accuracy, trueness and precision, Accred Qual Assur, Vol. 12:45–47
[4] Joint Committee for Guides in Metrology (2012). International vocabulary of metrology – Basic and general concepts and associated terms (VIM), JCGM 200:2012