Internal quality control, method monitoring and quality control charts
Internal quality control (QC) – what’s that? You routinely perform laboratory analyses, but do you know whether your method also generates permanently reliable results? Yes of course, the method was validated once a long time ago, but since then...? Can you make a statement about the stability of the method? If such questions don't sound entirely unfamiliar, we’d like to introduce a tool today that precisely addresses this issue.
Introduction
The performed validation of an analytical method only provides a snapshot but does not provide any information as to whether the method is really suitable long term, as the real process (i.e. taking into account the time) is not considered. Quality control charts are suitable for investigating this. They are part of statistical process control (SPC). There are various types of quality control charts, which are described in the DIN ISO 7870 series of standards, including the Shewhart quality control chart.
Internal quality control is a control program for the continuous, critical evaluation of the laboratory's own analytical methods to ensure that the data generated is always of the correct quality for the intended purpose of the method. The control program includes the use of concurrent QC control samples, the continuous entry of their results in a suitable quality control chart after defining suitable warning and action limits as well as an appropriate control rhythm for regular review. In this context, the term method (performance) monitoring is used.
A practical example first
Prior to take a closer look at a Shewhart quality control chart, let's start with an example. An analytical method has been transferred from a company to a contract laboratory. The method was already very old, and the contract laboratory therefore optimized the method and then revalidated it. For this method, QC control samples were and continue to be run in parallel with the actual samples for each analysis. These QC control samples are also known as internal product control or control material and can be, for example, a sufficient quantity of a previously defined and well-characterized batch that has been specially qualified for this purpose or, depending on the sample, commercially purchased certified reference material. The QC control sample is treated in the same way as the actual test samples to be analyzed. After each analysis performed, the new result of the QC control sample is entered in a quality control chart and the chronological sequence of the results is checked.
In our example, sufficient historical data of the QC control samples were available, but since the method was optimized and re-validated, it was not clear whether the new values generated with the optimized method would behave like the old ones in the future and thus, if the quality control chart set up with the historical values would still continue to be suitable...
The background: Normal distribution
Now that we’ve got a good practical idea of this, we should go into more detail to understand the background of the quality control chart’s structure and thus the problem outlined above. As we all know from our school days, among quantitative data (measurable on a scale) there are those that are normally distributed and those that are not.
To use the quality control chart described here, the data must be normally distributed, i.e. follow the typical Gaussian bell curve (see following figure). This is because the structure of the Shewhart quality control chart described here is based on the principles of normal distribution. But what exactly is meant by “normal distribution”?
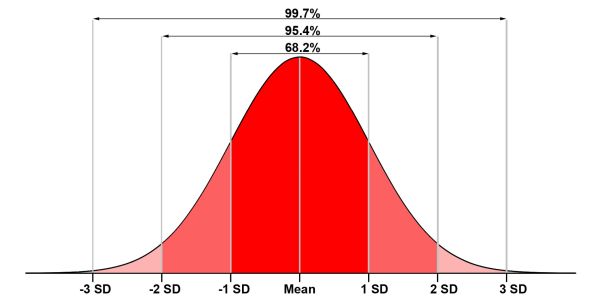
The Gaussian bell curve (frequency curve) illustrates the relative frequency of a characteristic in an infinitely large data set. With normally distributed data, as shown here by the bell curve, the individual values of the data set spread around the mean value (MV; editor's note: Correctly, I should actually talk about the expected value µ... but for reasons of simplification, we’ll stick to the mean, as it is easier to imagine). The spread is expressed by the standard deviation (SD). The range from -1 to +1 standard deviation contains approx. 68% of all values of the data set, between -2 SD and +2 SD are already approx. 95% and if the range of three times the standard deviation in both directions is considered, approx. 99% of all results are covered.
The structure of the Shewhart quality control chart
And for those who are now wondering why this excursion into the normal distribution was important, it should be noted that we also need information on the mean and standard deviation of the data set we are interested in to create a Shewhart quality control chart.
The Shewhart quality control chart is a demonstrative graphic in which the x-axis shows the progression over time and the characteristic values are entered on the y-axis. The 2SD and 3SD values, which act as barriers, are added as straight horizontal lines. The 2SD line is referred to as the warning limit and the 3SD line as the action limit. The values may move between these limits. Even though the use of 2SD and 3SD is most common for warning and action limits, other limits can of course also be used depending on the characteristic.
In a "preliminary test", the mean and the standard deviation are determined using a certain amount of data from the past (if we think of the example above about the laboratory method, these were the "historical data"). In principle, the more data, the more stable the limits derived from the standard deviation. In [1], approximately 25 values are recommended for the start, which can also be based on the results of the method validation.
But let's illustrate the construction and structure of a quality control chart with the help of an example. We have the following historical data of the QC control sample of a content determination of tablets (in this example: 20 batches analyzed):
| Content [mg] | Statistical characteristics [mg] | |
| 1 | 399 |
Mean: 398.8 SD: 5.3
2SD 10.7 3SD 16.0
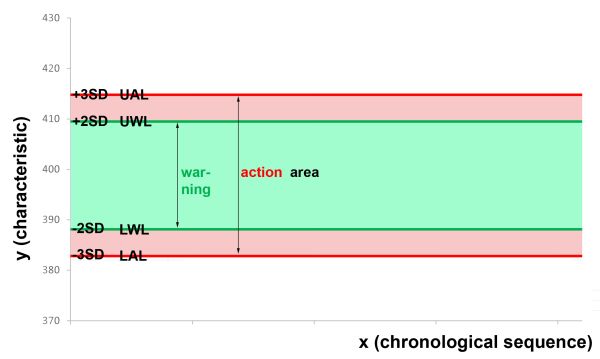
Lower warning limit (LWL): MV – 2SD = 388.1 Lower action limit (LAL): MV – 3SD = 382.8 Upper warning limit (UWL): MV + 2SD = 409.5 Upper action limit (UAL): MV + 3SD = 414.8
|
| 2 | 393 | |
| 3 | 402 | |
| 4 | 394 | |
| 5 | 405 | |
| 6 | 397 | |
| 7 | 395 | |
| 8 | 401 | |
| 9 | 394 | |
| 10 | 392 | |
| 11 | 406 | |
| 12 | 407 | |
| 13 | 390 | |
| 14 | 397 | |
| 15 | 405 | |
| 16 | 399 | |
| 17 | 392 | |
| 18 | 405 | |
| 19 | 403 | |
| 20 | 400 |
We now use these numbers to construct the preliminary quality control chart: In a diagram with the progression over time on the x-axis and the characteristic value on the y-axis (here: content in mg), we draw the LAL in red at 382.8 mg, the LWL in green at 388.1 mg, the UWL in green at 409.5 mg and the UAL in red at 414.8 mg as horizontal lines corresponding to the 2- or 3SD limits. The areas in between are the corresponding warning or action area. It looks like this:
In case of historical data with suspected outliers, the use of robust estimation methods is recommended in [2]. Furthermore, after a certain, longer period of time, it should be checked whether the quality control chart generated with the historical initial data is suitable for practical use. A period of one year and at least 60 values is recommended in [1] for final determination of the limits. In addition, for the subsequent period, the intervals at which the control limits should be re-evaluated should also be defined company-internally.
Purpose and possible applications for quality control charts
Now that we’ve seen how a quality control chart is structured, we should think back to our initial example, which brings us to the question of what purpose such quality control charts serve. The above example already indicates it: the regular entry of our analytical results of the QC control sample after each analysis performed into a quality control chart helps to recognize time-dependent changes at an early stage. We use it to monitor the influence of systematic and random errors on our analytical method. Spontaneous deviations from the usual course are recognized immediately by exceeding the warning or action limit.
It's perfectly okay if one value lies between the warning and action limits, as we cover only 95% of all results with ± 2SD (for the warning range), i.e. 5% are allowed to be "outside"... However, if a value lies outside the action limit (which only occurs in 3 out of 1000 measurements), it is very likely that this analysis was incorrect. But even before a warning or action limit is exceeded, for example, trends (= directional accumulations) can also be recognized if all data is still within the normal range, but the values are becoming increasingly lower and lower, for example... Or if suddenly an unusual high variability is seen in the data that was not there before... That should make you think! Something is not correct anymore. But since thinking alone is not enough, you should of course also search for the underlying cause 😉 A possible simple explanation could be, for example, the use of aged reagents...
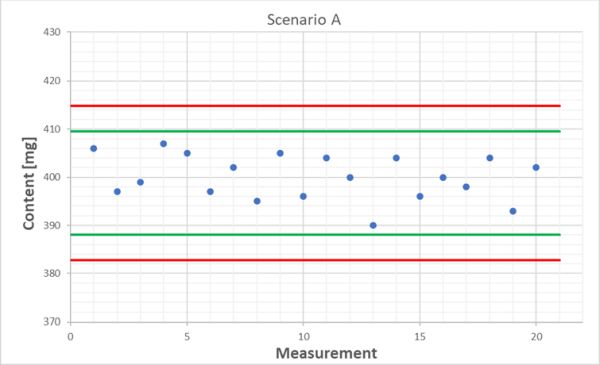
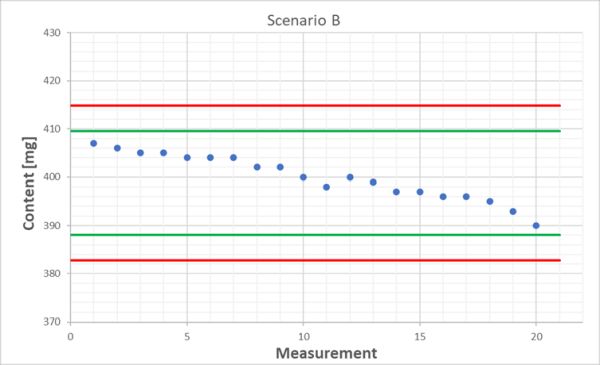
We stick with our tablet content determination and look at the following two scenarios. We’ve got 20 results each from the QC control sample and the mean for both is exactly 400 mg and the standard deviation is 4.7 mg in each case. These data don’t tell us anything. Without visualization using a quality control chart, we could naively think that both behave in the same way. However, if we look at the respective time trends, we see that everything is fine in scenario A, as all values spread around the mean, sometimes upwards and sometimes downwards. Scenario B is different: here we can clearly see a decreasing trend!
By using a quality control chart, we can always keep an eye on the performance of our analytical method (keyword: "Method Performance Monitoring" or "Ongoing Monitoring"). However, not only the pure measured value of the QC control sample, but also, for example, SST criteria, the recovery of a spiked positive control or calibration parameters such as slope or intercept can be monitored with the help of a quality control chart.
In addition to the actual analytical method, quality control charts can also be used, for example, for inspection of measuring and testing equipment when checking the analytical balance(s) or pipettes every working day in the morning. And if we think outside the box, the use of quality control charts makes particular sense for process parameters such as the filling quantity in filling processes in the pharmaceutical or food industry. In these cases, it makes sense to use defined target values as limits instead of 2 or 3 standard deviations.
According to [1], the results of a quality control chart can also be used, for example, to determine the measurement uncertainty, to compare methods, to estimate the limit of detection (not necessarily in the pharmaceutical sector) or to evaluate round-robin tests, depending on the type and QC control sample used.
Of course, the handling of potential "irregularities" (deviations, variability, trends) to be observed must also be managed internally within each company. In other words:
- What should be done if something is observed?
- How do you react in which case?
- What do you do if you "only" have a single deviant who is between the warning and action limit? What if it is outside?
- In which cases do you say that the method is statistically out of control in long-term evaluation, e.g. if 6 [2] or 7 [1] consecutive values are steadily decreasing or increasing or x consecutive values are on the same side of the mean?
Finally, a few regulatory words
Even though the EU GMP guidelines do not explicitly mention the use of quality control charts in chapter 6 on quality control, there are indications that analytical test results should also be examined regarding trends [3], for which the use of quality control charts is a good idea.
The situation is different regarding the control of the production process. Here, the German aide-mémoire of the Central Authority of the Federal States for Health Protection of Medicinal Products and Medical Devices (German: Zentralstelle der Länder für Gesundheitsschutz bei Arzneimitteln und Medizinprodukten, ZLG) on the inspection of validation of manufacturing processes (AiM 07122901) makes an excursion into, among others, statistical process control and also explains quality control charts [4]. Annex I.9 of the ICH Guideline on Risk Management Q9(R1) also refers to the use of, among other things, quality control charts as supporting statistical tools for quality risk management [5].
To bring us back to a quality control laboratory, let's look at DIN EN ISO/IEC 17025:2018. Compared to chapter 6 of the EU GMP guidelines, this standard is much more specific, as section 7.7 requires the use of statistical techniques to monitor analytical results regarding trends and also requests taking appropriate measures in the event of values outside defined (action) criteria to ensure the validity of results. The use of control charts is also mentioned regarding the inspection of measuring and testing equipment [6].
During the more recent developments of the analytical procedure lifecycle concept, continuous monitoring of the analytical method is recommended in the ICH Q14 [7] and in chapter <1220> of the US pharmacopoeia (USP), including the use of quality control charts [8].
To summarize, depending on the regulatory environment of the laboratory, the use of quality control charts may not be necessary in every case, but it does make sense and is attracting increasing attention.
References
[1] Magnusson B., Hovind H., Krysell M., Lund U., Mäkinen I. (2018). Handbook of Internal Quality Control, Nordtest Report TR 569 (edition 5.1)
[2] Ellison S.L.R., Barwick V.J., Duguid Farrant T.J. (2009). Practical Statistics for the Analytical Scientist: A Bench Guide, 2nd edition, RSC Publishing, ISBN: 978-0-85404-131-2
[3] European Commission (2014) “EU Guidelines for Good Manufacturing Practice for Medicinal Products for Human and Veterinary Use”
[4] Zentralstelle der Länder für Gesundheitsschutz bei Arzneimitteln und Medizinprodukten (2017) „Inspektion der Validierung von Herstellprozessen (Prozessvalidierung)“ (AiM 07122901)
[5] International Council for Harmonisation of Technical Requirements for Pharmaceuticals for Human Use (ICH) (2023) “Quality Risk Management” Q9(R1)
[6] DIN EN ISO/IEC 17025:2018
[7] International Council for Harmonisation of Technical Requirements for Pharmaceuticals for Human Use (ICH) (2023) “Analytical Procedure Development” Q14
[8] United States Pharmacopoeia, USP-NF (2022) <1220> “Analytical Procedure Life Cycle”